KISSmetrics webinar on Split Testing
A couple of weeks ago I joined a KISSmetrics webinar on Split Testing, given by Lars Lofgren. Lars had some great advice on using split testing effectively. These are my notes.
The wrong way to A/B test
Most people try testing different colours for their buttons, or changing a page's layout (e.g. moving a form from one side of the page to another). Their conversion rate only goes up a small amount (e.g. 4%). It's not worth the effort.
More importantly, these tests don't teach you anything about your customer; you should be doing tests that help you understand your customers. That learning will help you improve further in future.
The biggest return you can get from A/B tests is to learn who your customers are, and what they're looking for.
To get those insights you need qualitative data, not quantitative data. How do you go about that?
- Use other sources to get a basic understanding of what your customers want.
- Predict ways that you can improve.
- Confirm or refute your predictions with A/B testing.
So where can you find the qualitative data?
1st qualitative source: Surveys
Use KISSinsights to ask a single question that will help you understand what your customers are going through. For example, an e-commerce site could ask "You did not make a purchase today, can you tell us why not?" Suitable multiple choice answers include:
- "Just browsing - did not intend to make a purchase"
- "Did not find what I was looking for (please explain):"
- "Prices were too high"
- "Other:"
You should also use longer surveys, from sites such as Survey Monkey or Wufoo. The surveys are hosted on a web site; you can send people a link to the survey in an email.
Use open ended questions like these:
- If there was 1 thing that would have convinced you to upgrade your account, what would it be?
- We all have something we change; if there was one thing you would change about Agile Planner, what would it be?
- If you were the CEO of Agile Planner, what would you do to make it better?
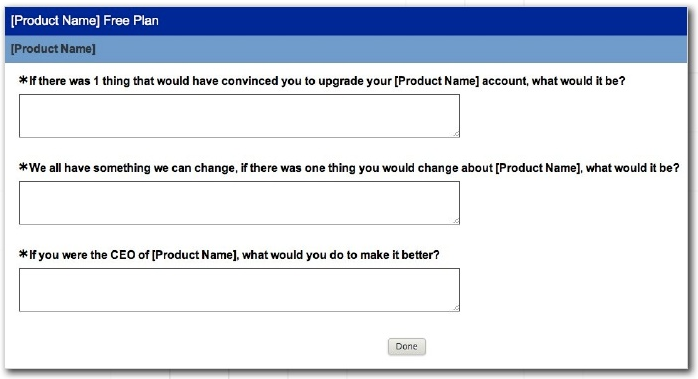
That screenshot (and the one below) is taken from Lars' slides.
Best practices for surveys:
- Keep them short
- Only ask for answers that you'll use
- Start with open-ended questions
Use open ended questions to begin with, encouraging people to give explanatory responses, giving them a chance to tell you how they feel. When you understand more you can try and test specific hypotheses with multiple choice questions (in a later survey).
2nd qualitative source: Feedback
At the bottom of every page on KM there's a little form that says "how can we make this page better for you?". When people fill it in it goes out in an email to the KISSmetrics team. They don't try to act on everything that is suggested; they're looking for trends.
3rd qualitative source: Reach out to your customers
Get them on the phone and try to get a deep understanding of how they use your service. If they fear not having a feature, find out why; you could be solving a symptom by implementing it for them, rather than by solving the actual problem. Take people out for lunch/coffee.
Focus on asking good questions, and listening. Remember that you're not pitching here; you're not selling anything, you're learning
Focus on asking really good questions, and listening.
4th qualitative source: User activity
You need an analytics platform for this. The reports in the "People" tab of KISSmetrics will show you which events people are kicking off on any given day.
If you come across some interesting user behaviour when looking at the events triggered by an individual user, confirm your potential insight by looking at the behaviour of other customers too. You should expect that some users will behave unusually.
5th qualitative source: Usability tests
Get somebody to use your app, while you watch. If you can't find anybody locally, usertesting.com is recommended.
When to test the small stuff
The process above will help you find big wins quickly, but once you've done some of the big stuff you can find that a few of the 4% improvements mentioned earlier can add up.
Work on the small stuff after you've found the big wins and you have a full-time growth team. You need a lot of resource to get a lot of benefit from the small conversion increases though.
A/B Testing Tools
A/B testing tools are good for testing variations on copy, photos, and layouts. They're not good for testing more long term effects such as pricing.
To test bigger changes you need to be able to see how things impact your business over the long term. To do that you need to connect an A/B testing tool to an analytics tool. You can then see which A/B test outcome gives the best return over a longer period.
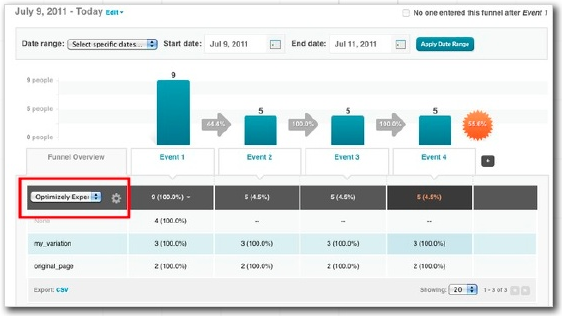
Use Visual Website Optimizer or Optimizely. They're equally good, and both integrate with KISSmetrics. You can get all the data from the split testing tool and insert it into KISSmetrics, and then segment customers in a KISSmetrics funnel report by the experiments that you did in Optimiz(er/ly).
Statistical significance
With a small data set, the odds of your outcome being random are high. You want to get 95% statistical significance. Punch your numbers into a calculator. If you have a small to medium traffic site it can be very difficult to get that significance.
During the webinar, I then wrote down:
As a rule of thumb, if you've got two options in your test and you wait until you've got 100 conversions on each (or 200 in total) then there's a good chance that you've got statistical significance. If you can get 200 conversions in a couple of weeks you have enough traffic to support an A/B test.
I did wonder about this at the time, as it differs significantly from advice I've come across in the past. But, I was watching a webinar from KISSmetrics, for whose opinions I have some time!
Georgi Georgiev pointed out (in the comments – see below) that significance depends on the magnitude of the observed difference from your baseline, as well as sample size. The rule of thumb above is clearly not the full story (sorry Lars).
Instead, I recommend you:
- Read Georgi's comment, and
- Calculate significance properly (here's a significance calculator to get you started).
Useful links
- Lars Lofgren on Twitter
- The slide deck
- Optimizely
- Visual Website Optimizer
- My A/B testing bookmarks on Pinboard
- Detailed notes on statistical significance: How not to run an A/B test
Thanks Lars! It was an hour well spent...